Features of ProAqCT
Click me to learn more!
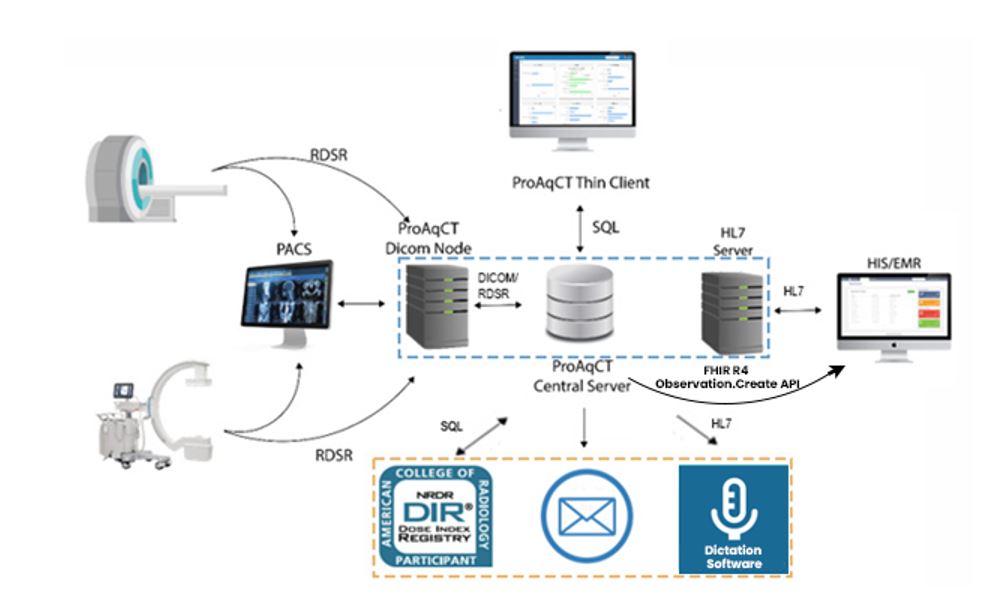
Fast & Easy Installation
ProAqCT is a vendor agnostic dose & image quality monitoring system compatible with all CT, Fluoroscopy, PET, and nuclear medicine vendors. With direct integration to the EMR, patient dose & quality data are automatically added to the patient chart via HL7.
One of the many ways ProAqCT offers an
affordable dose management solution is
with a light IT footprint. Because
ProAqCT runs in an OS-level virtual
container, it can be remotely deployed
behind the network firewall on a virtual
server or a physical machine.
We also
offer deployment on a HIPAA compliant
AWS cloud service. The cloud service eliminates
the need for costly server hardware on-site as
well as organizational IT resources. AWS expertly
supports all server maintenance to relieve your organization's IT burden.
Our team of IT specialists provide all
necessary technical resources and work
with your organization to deliver fast and
expert end-to-end installation.
30 day installation guaranteed!
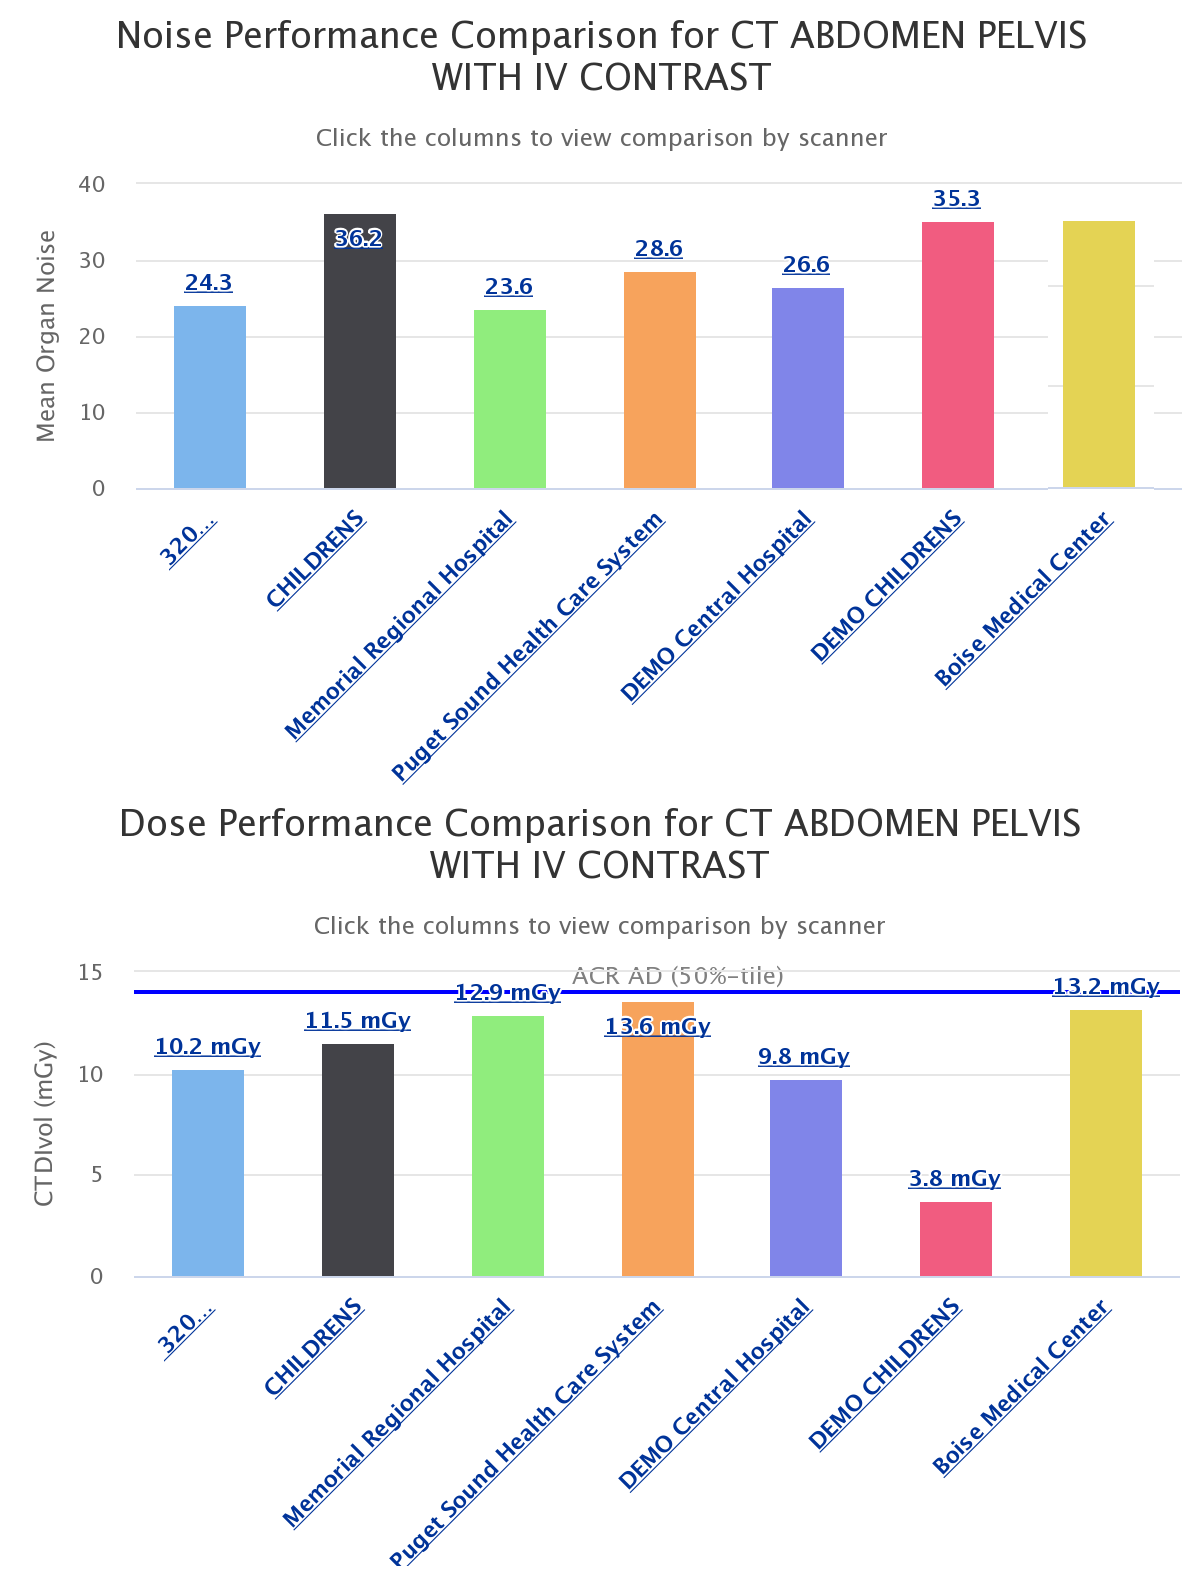
Optimal Image Quality at the Lowest Dose!
Track & Optimize Scanner Image Quality with Automated Image Quality Monitoring
ProAqCT ensures optimal imaging at the lowest doses by automatically monitoring clinical image quality in addition to patient dose.
Using machine learning, ProAqCT performs objective image quality measurements on patient scans and
trends image quality vs dose. This allows users to benchmark image quality metrics vs. dose across different
scanners per protocol, standardize protocols, and maximize quality in a patient-specific manner.
Objective Image quality metrics, such as average noise,
can be compared across scanner protocols. Our Image
Quality analytics are designed to provide insights into
protocol and scanner performance that lead to more
optimal and standard imaging practices.
Click me to learn more!
Click me to learn more!
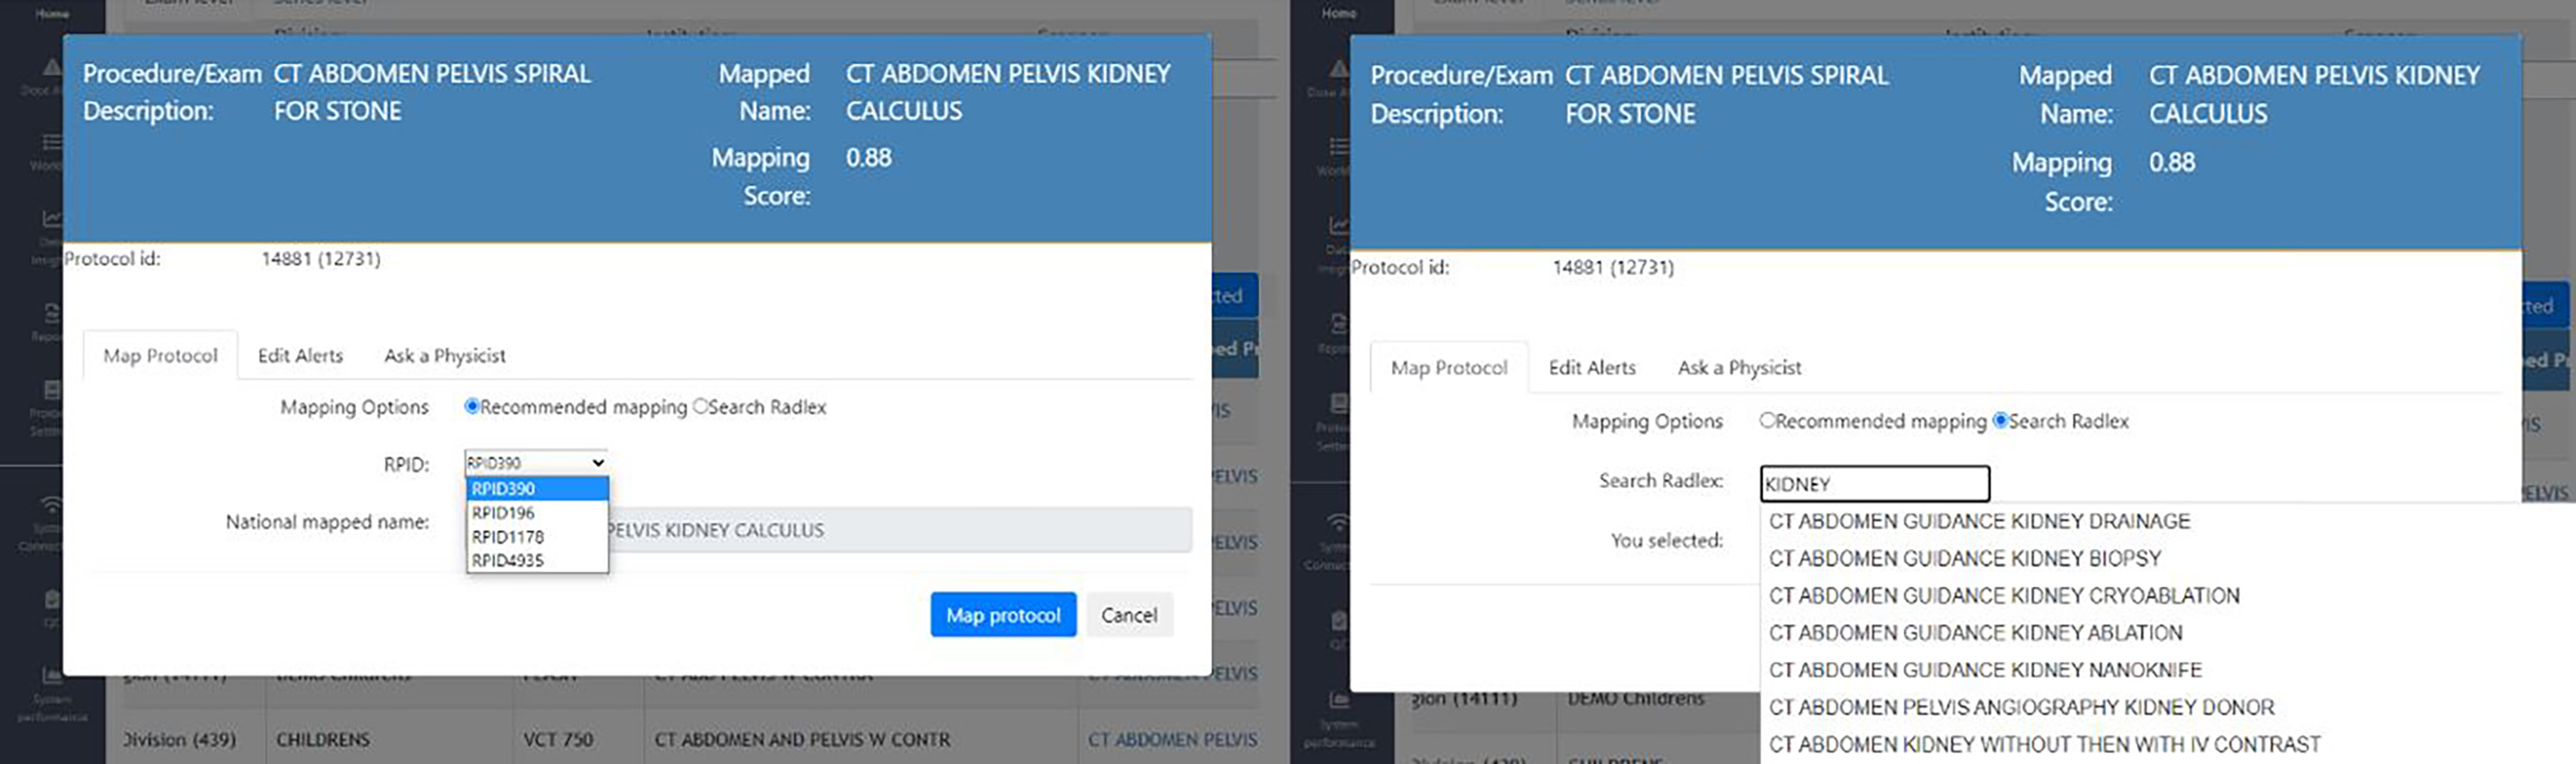
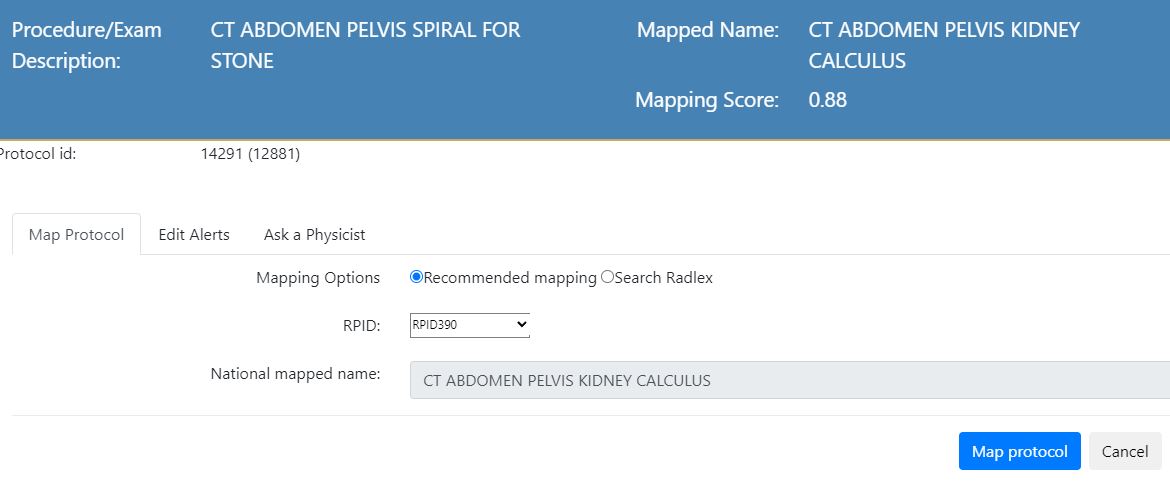
Automated Protocol Mapping
ProAqCT uses machine learning to precisely map protocols to Radlex or any other lexicon. A mapping score, indicating the accuracy of the mapping selection, is provided for each mapped exam. When mapping accuracy falls below 90%, users receive alert notifications so that the mapping can be verified. This powerful mapping technique improves dose data analysis and prevents alert fatigue by reducing the number of false positive alerts.
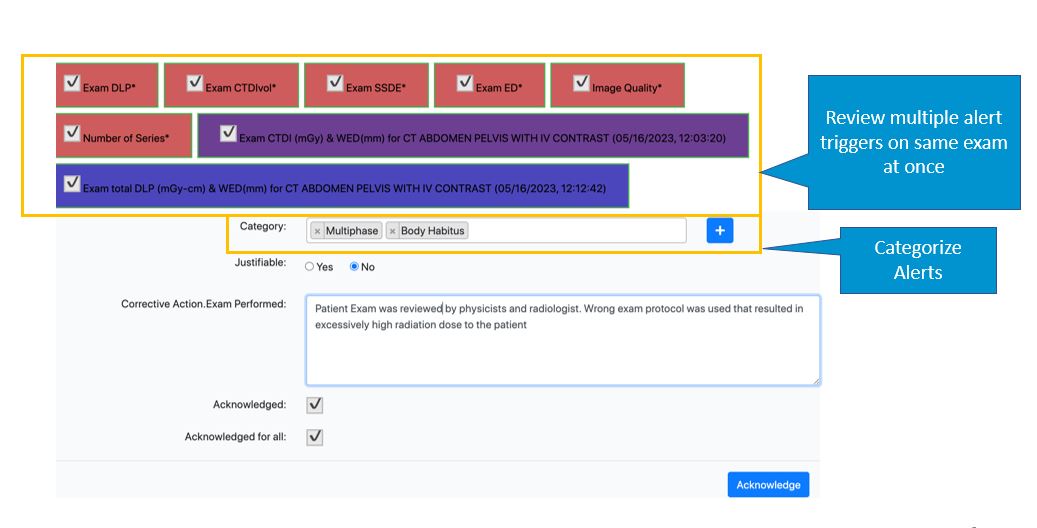
Simplified Patient Dose Review
ProAqCT makes it easy to review patient doses. A summary of dose indices that exceed alert thresholds is clearly provided with each exam. The patient AP and Lateral dimensions are automatically determined from axial slice data to give accurate measurements of the patient’s effective diameter and water equivalent diameter (WED). Patient scan length and iso-centering data are also provided to facilitate the review of patient dose.
Click me to learn more!
Click me to learn more!
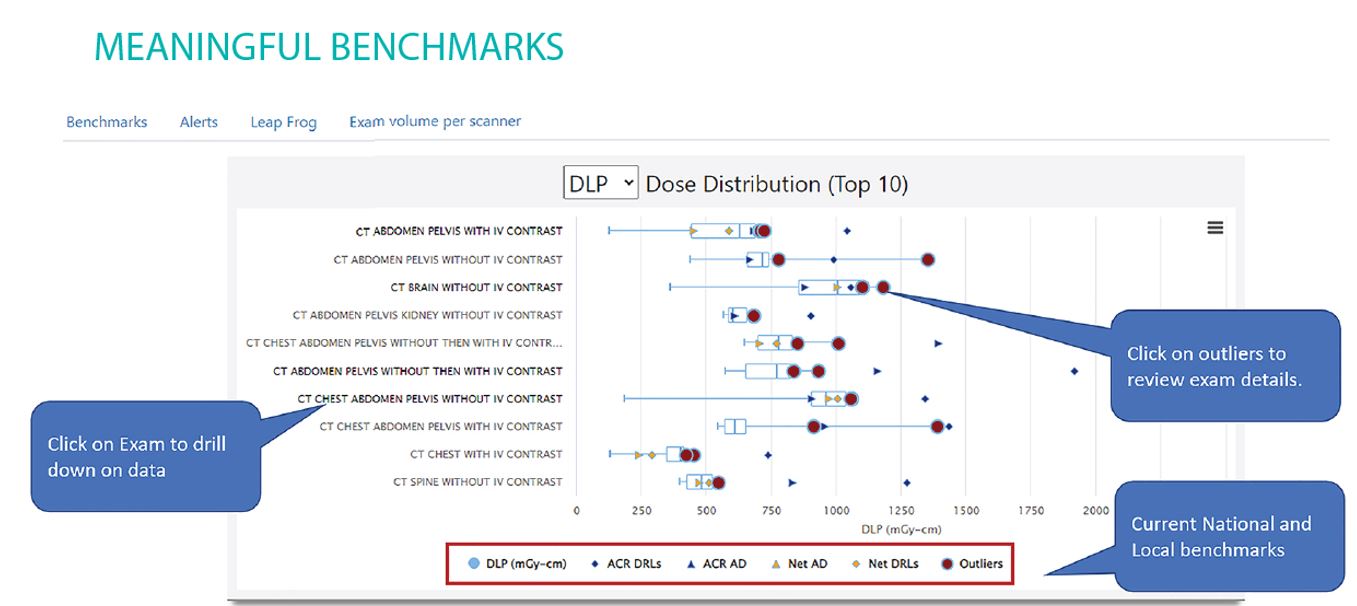
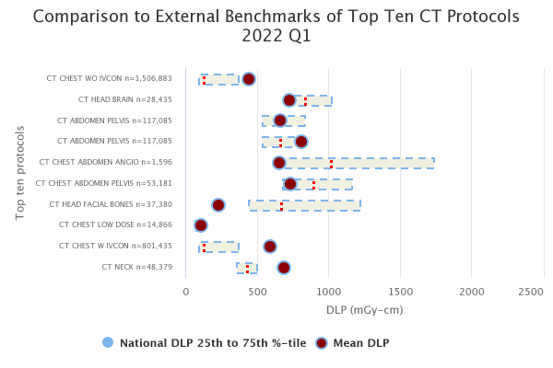
Meaningful Benchmarks
External benchmarks, both national and local, are included in ProAqCT dashboards, allowing users to easily compare scanner performance. Benchmarks are updated quarterly to ensure that performance is up to date with the latest standards and trends. Summary reports highlight protocol dose performances that are excessively high or excessively low in comparison to external performance standards.
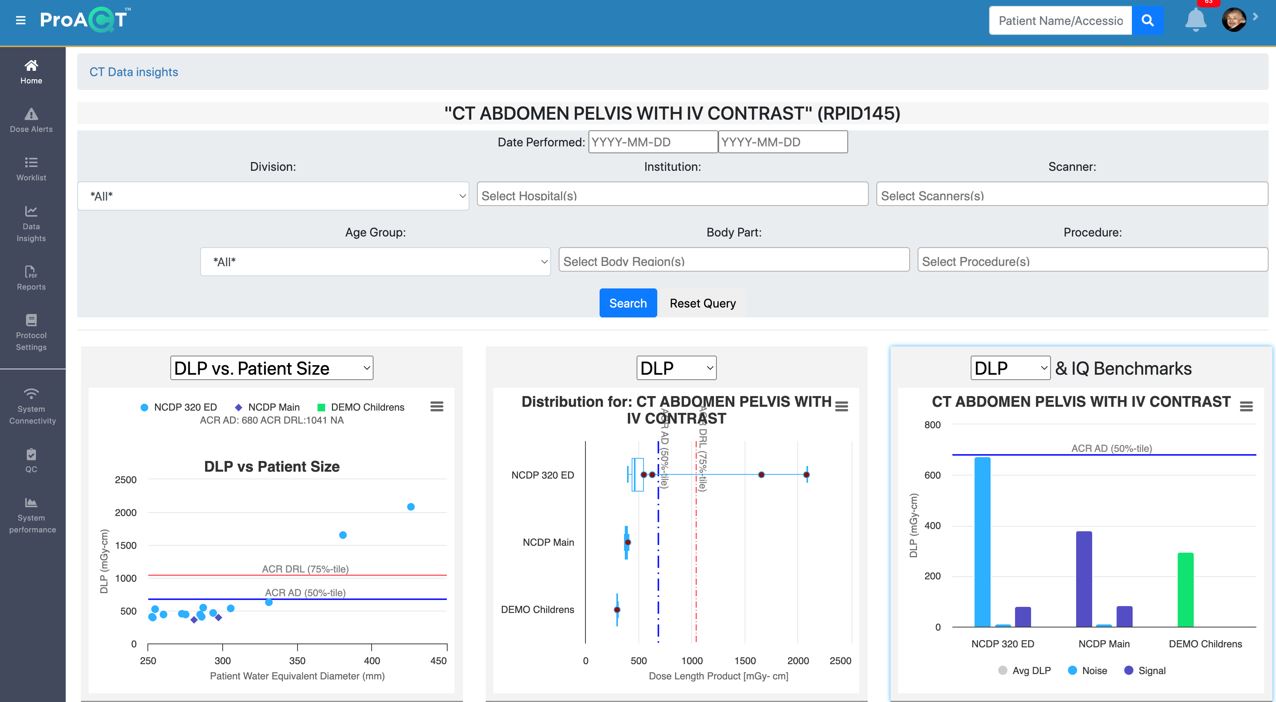
Data Insights
ProAqCT’s enterprise dose distribution analysis provides an easy way to track and audit patient doses by various categories, including patient size, scanner, scanner protocol and facility. The interactive dashboards allow users to drill down on dose data and pinpoint quality issues. For example, users can easily compare performance of an exam between sites and scanners and drill down to the scanner protocol level to identify variances in performance.
Click me to learn more!
Click me to learn more!
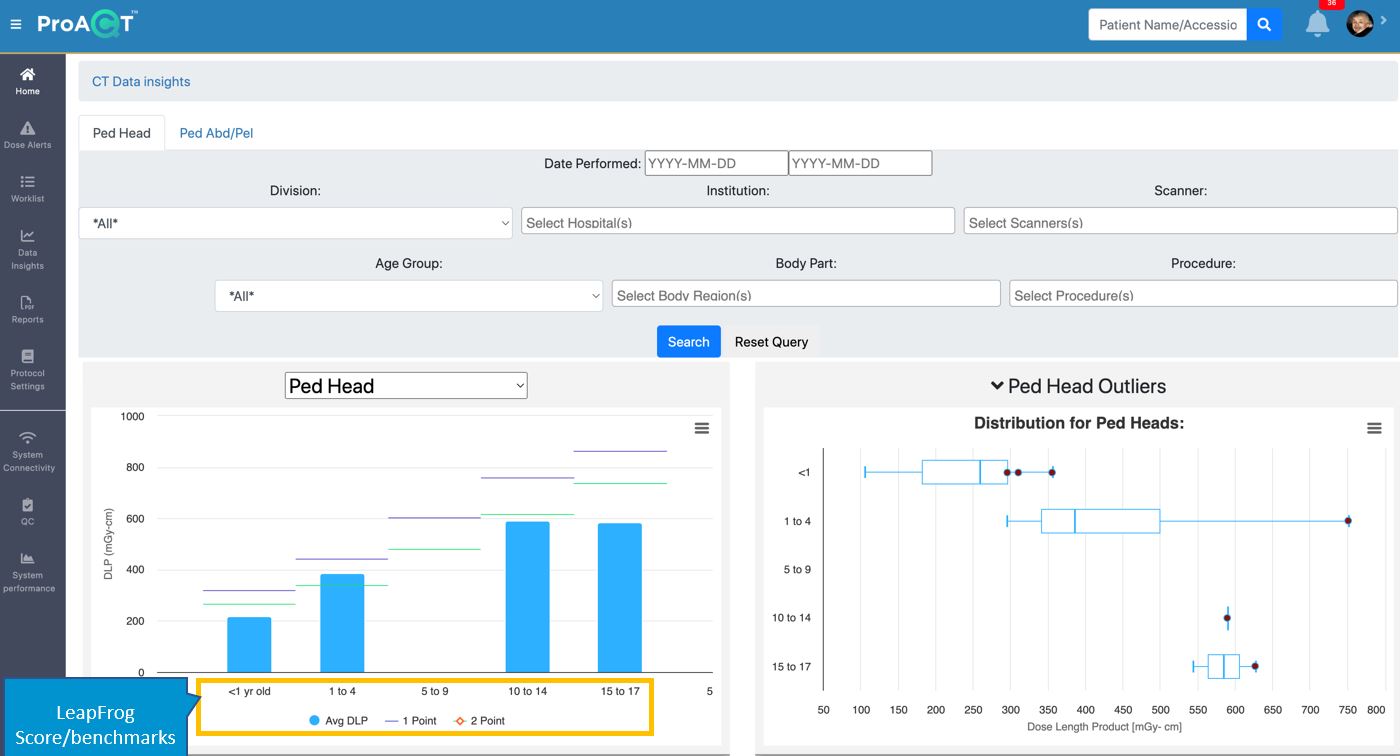
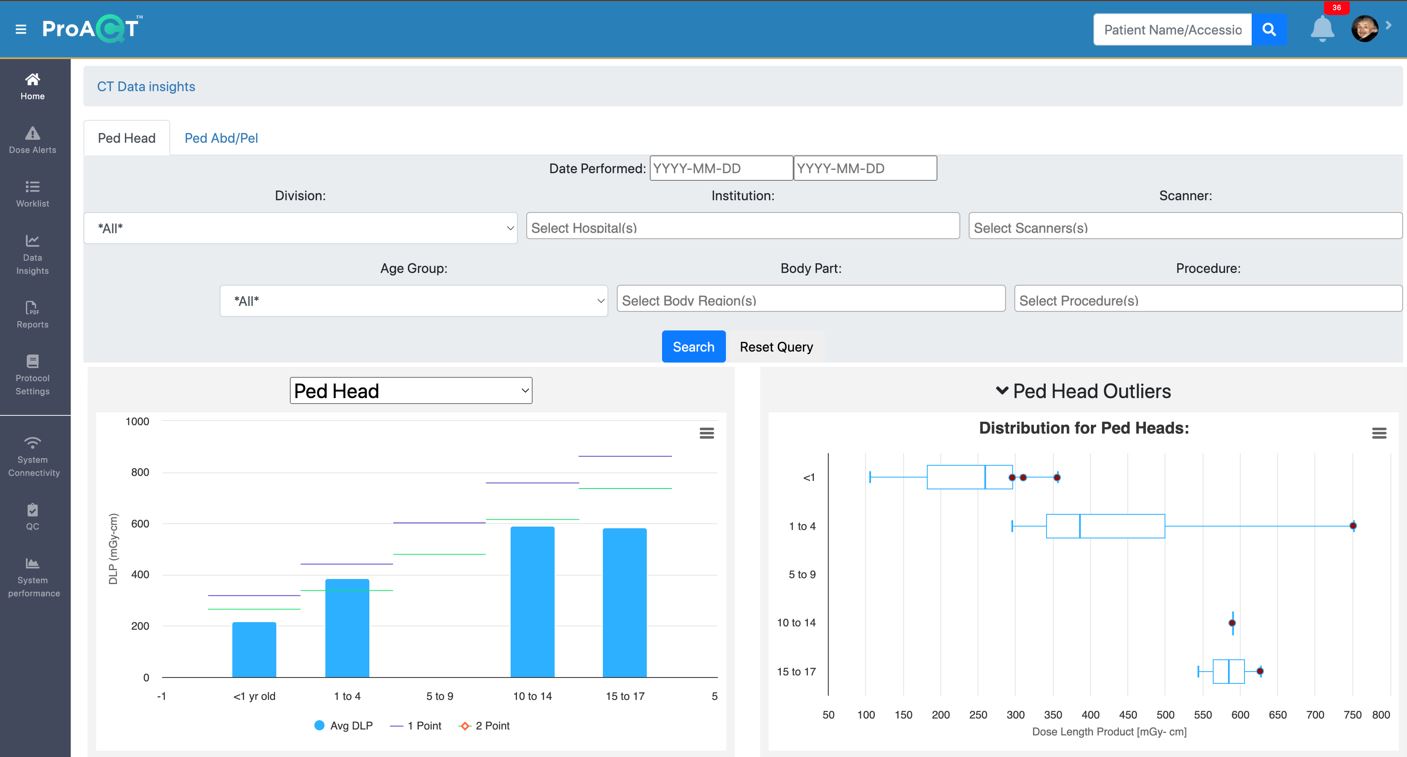
Realtime LeapFrog Dashboards & Pediatric Dose Monitoring
Improve your pediatric dose performance with realtime alerting of LeapFrog scores!
- Get LeapFrog scores in realtime for Ped Head & Abdomen
- Scores stratified by patient age according to LeapFrog
- Get Realtime notifications when LeapFrog scores drift from standard
Click me to learn more!
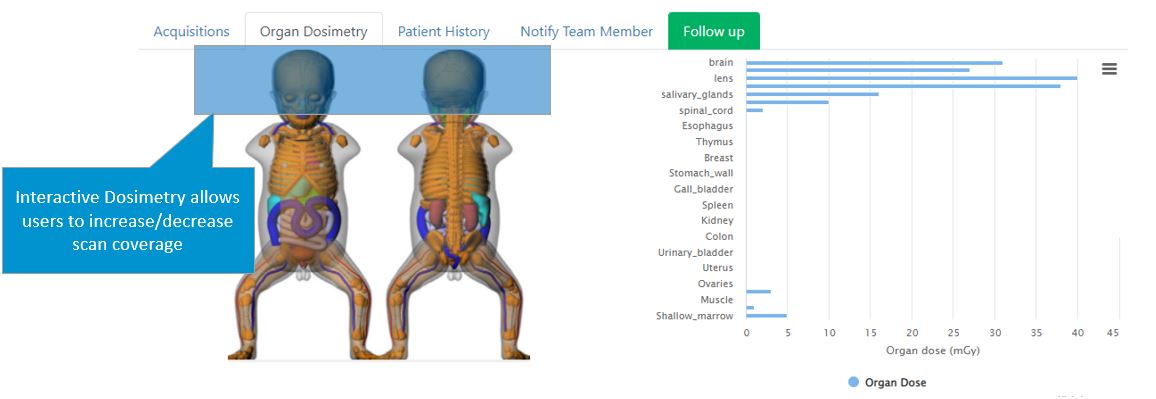
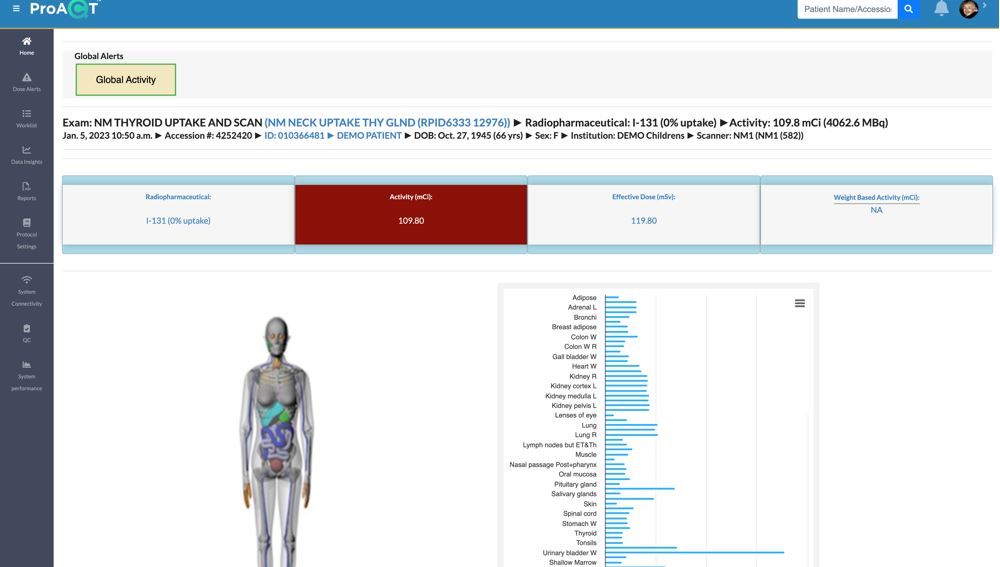
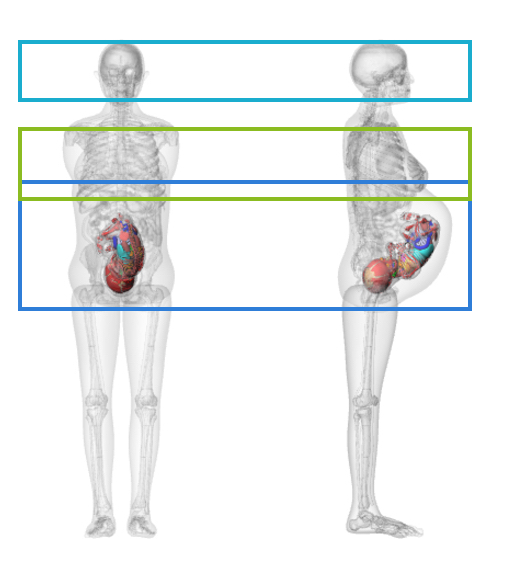
Advanced Dosimetry
ProAqCT uses state-of-the-art organ dose library matrices developed by researchers at the National Cancer Institute. This library includes organ doses from more than 370 computational human phantoms representing pediatrics and adults of both genders and various body habitus.
- Verify whether the patient had prior imaging studies of the same anatomic area.
- Track and Trend a patient's organ dose over time.
- Get Alerts when organ doses exceed deterministic thresholds for biological risk.
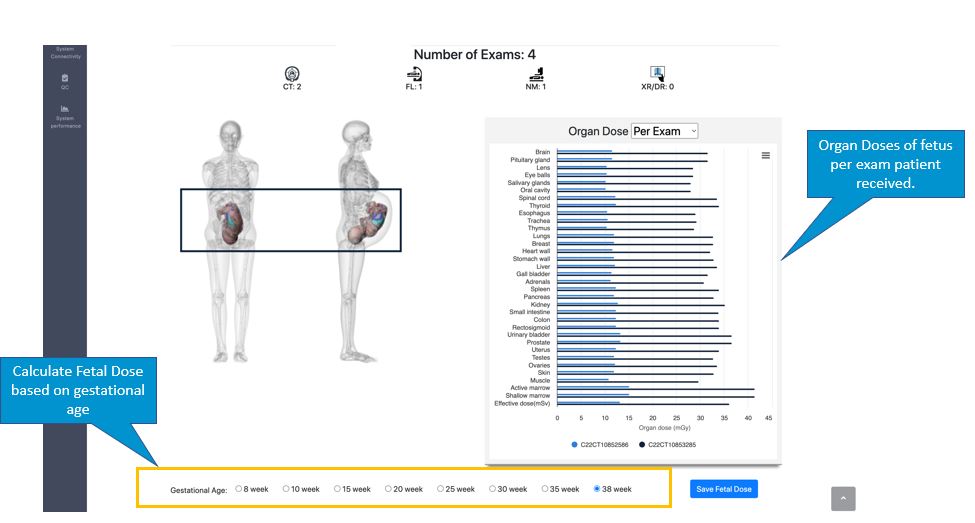
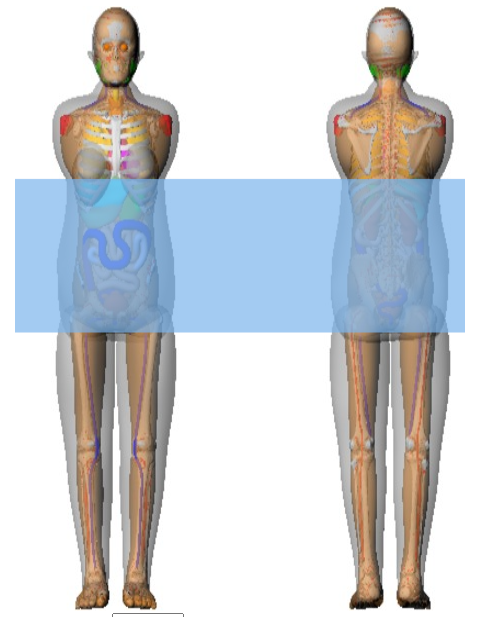
Fetal Dose Calculations
Automatically calculate fetal organ dose and effective dose on any pregnant patient. ProAqCT’s fetal dose calculator determines organ doses based on gestational age and exam scan range. Cumulative organ and effective dose for the fetus can be determined for any number of exams within the gestational age. ProAqCT also allows users to track and set alerts for fetal organ dose thresholds.
Click me to learn more!
Click me to learn more!
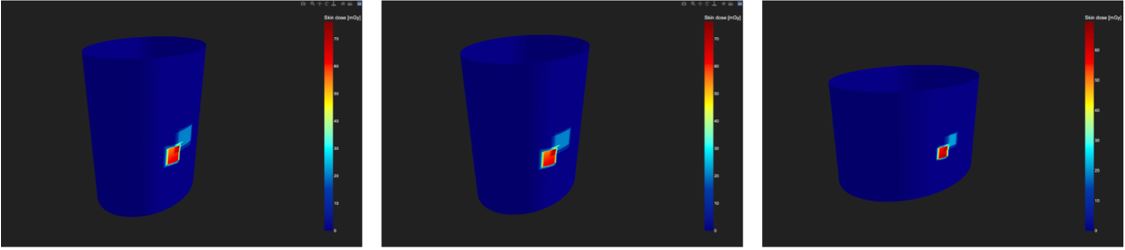
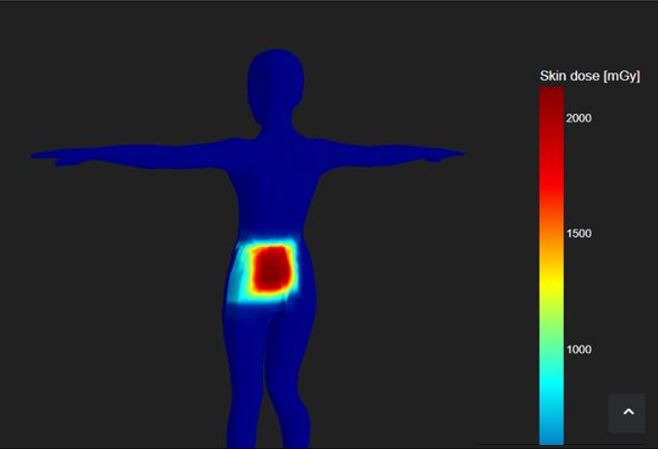
Interactive 3D Peak Skin Dose
ProAqCT delivers the most accurate patient peak skin dose calculation on the market. Using the full structured dose report, 3-D Peak Skin Dose maps are calculated for cath and IR procedures from any manufacture. ProAqCT achieves high accuracy peak skin dose maps by factoring system calibration factors, backscatter contribution, table attenuation, and all patient and beam geometry. The interactive UI allows users to rotate the antropromorphic phantom 360 degrees to review all areas of exposure. Automated Medical Physics Dose Evaluation reports that comply with the AMA 2021 publication of CPT 76145 are produced with one-click.
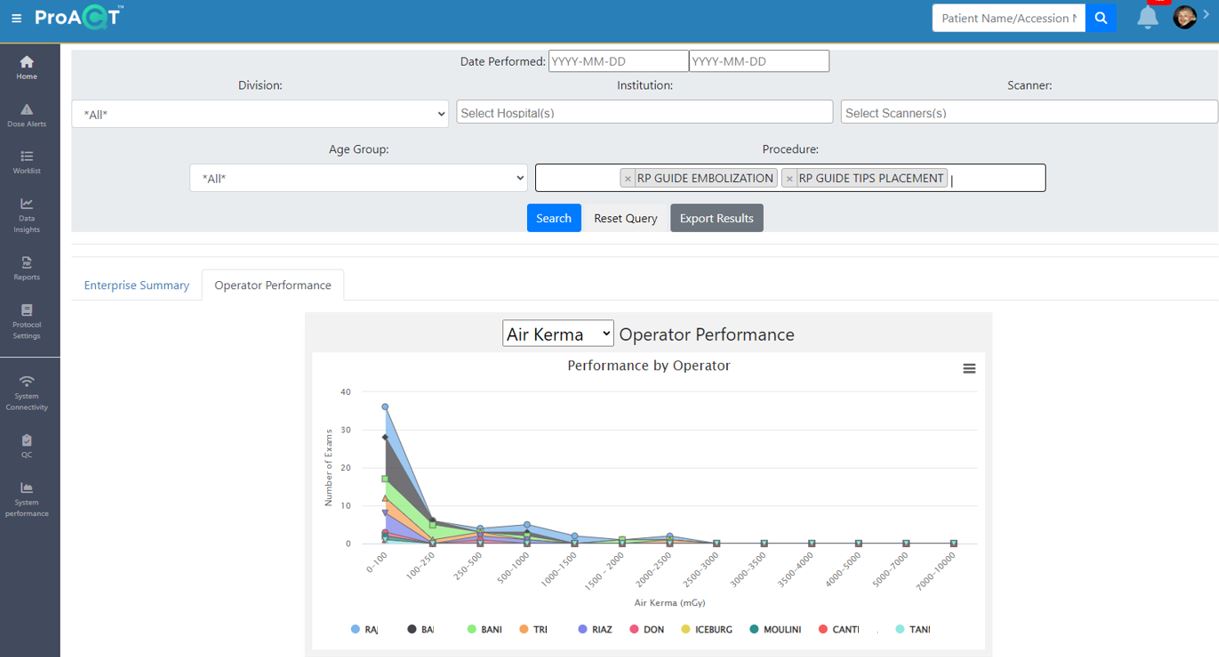
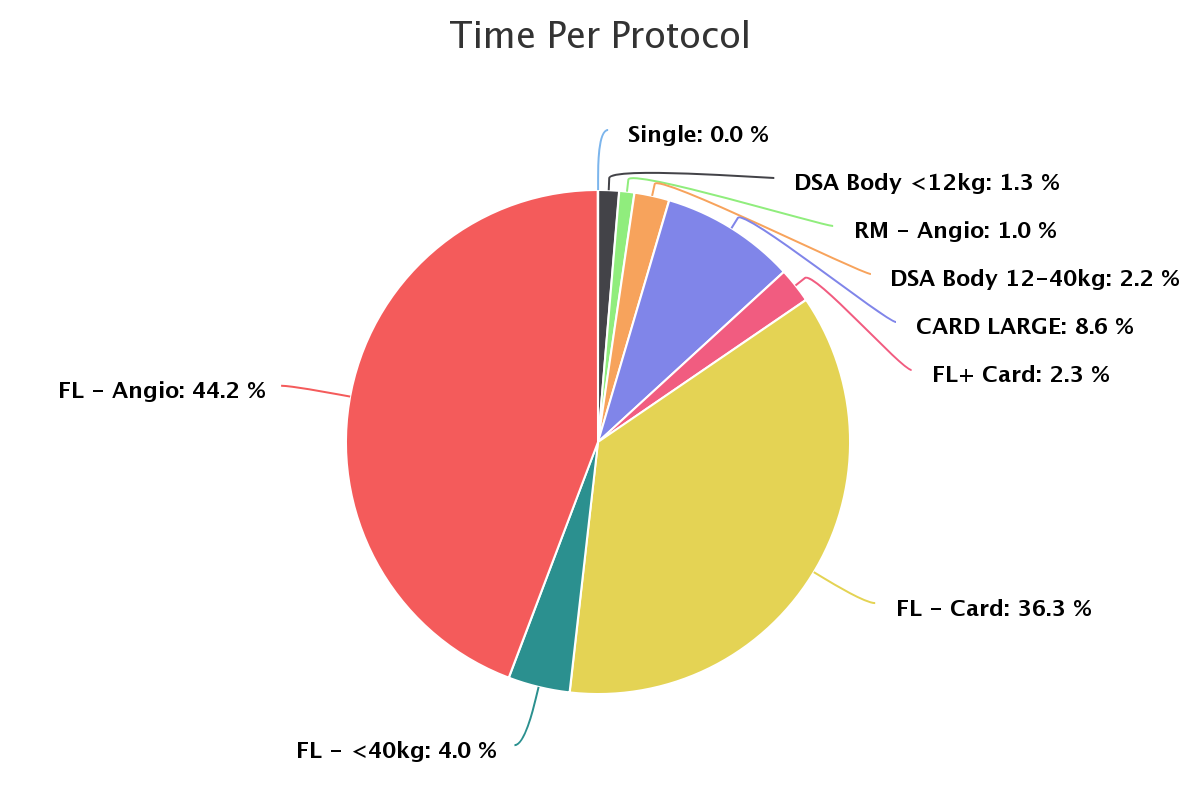
Fluoro Exam Insights & Operator Performance Benchmarking
ProAqCT analyzes exam and operator performance for each fluoroscopic exam. Benchmarks of operator performance per procedure, fluoro time spent on each fluoro setting, air kerma & DAP per frame rate, and other insights are included in our fluoro dashboards. These powerful insights into exam and operator behavior help prevent high patient exposures and maintain procedures at ALARA.
Click me to learn more!
Click me to learn more!
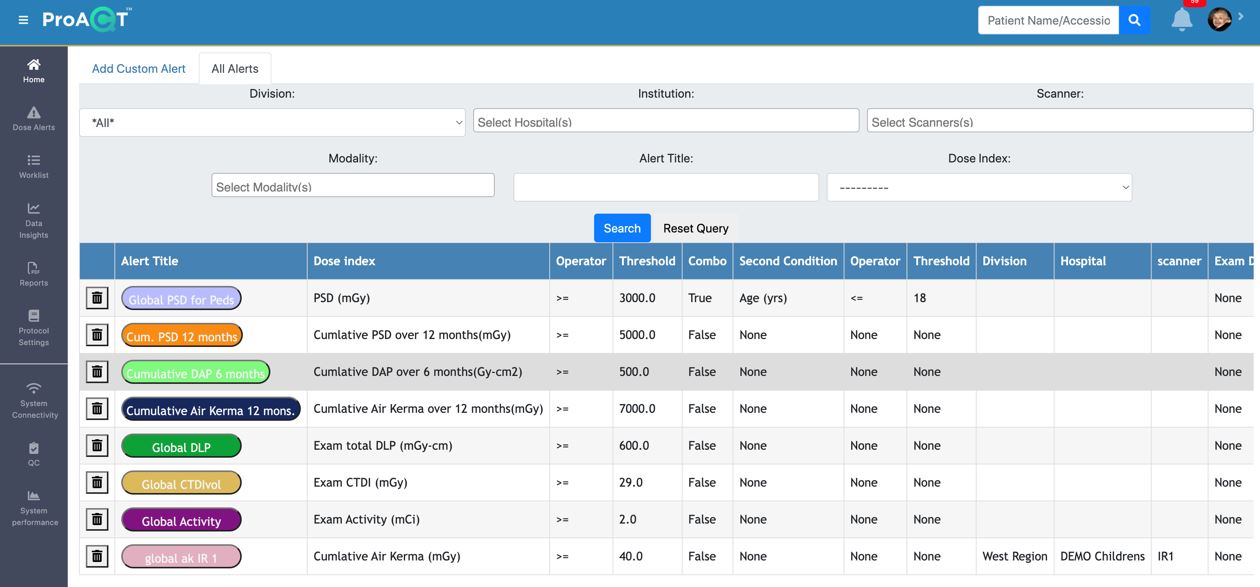
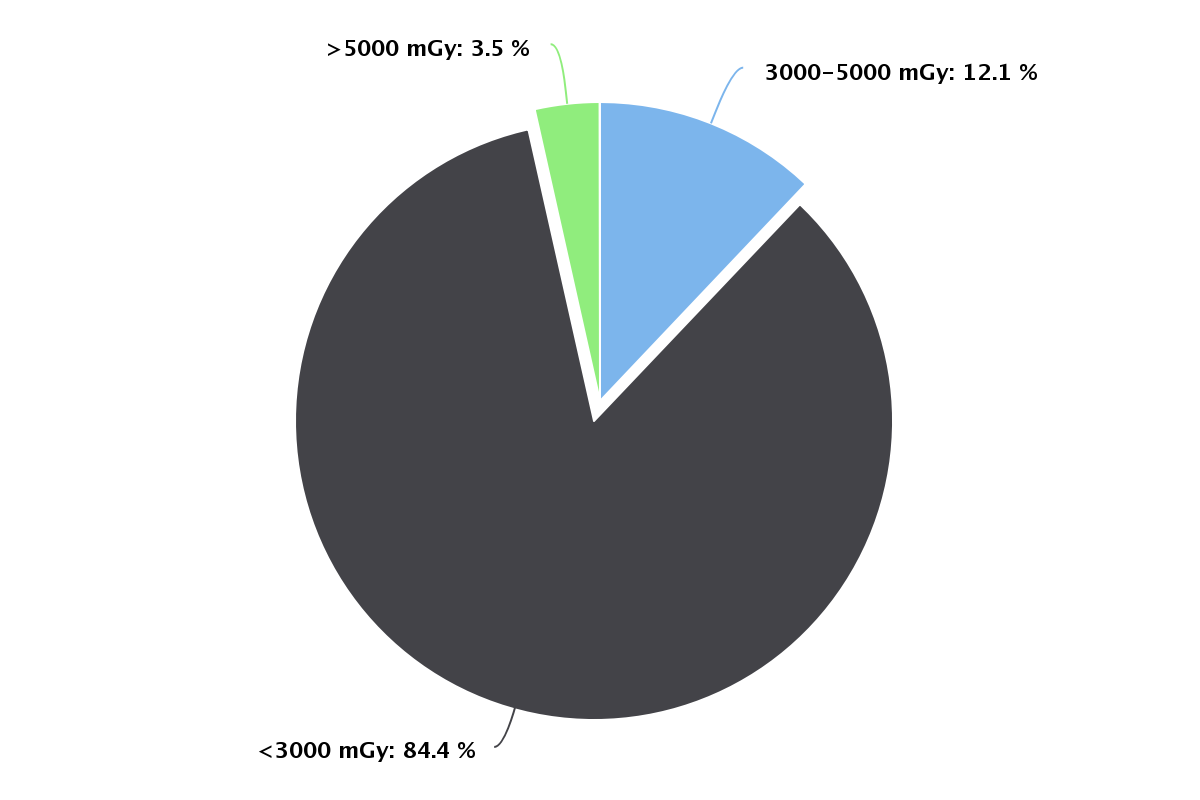
Comprehensive Fluoro Dose Monitoring
ProAqCT allows users to set customizable alerts based on fluoro time, peak skin dose, DAP or Air Kerma at patient and exam level. Alerts can be further customized by fluoro procedure or operator. Alert review dashboards allow users to benchmark and compare performance across operators, procedures, and systems to fully optimize fluoroscopic doses.
- Meets Joint Commission and standard of care fluoro dose monitoring requirements.
- Set customizable alerts based on fluoro time, PSD, DAP or Air Kerma at patient and exam level.
- Benchmark and compare performance across operators and systems.
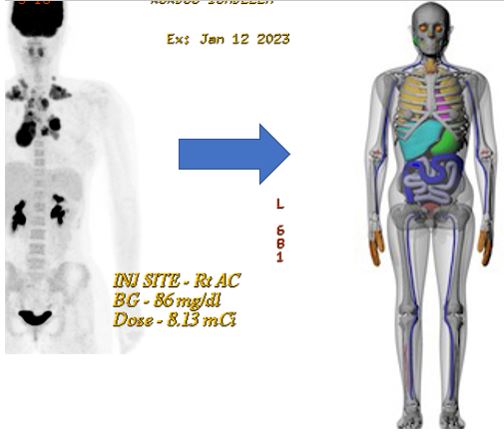
Monitor Nuclear Medicine Doses, Including Therapies, PET and SPECT!
ProAqCT applies the Medical Internal Radiation (MIRD) formalism to calculate organ and effective dose estimates for nuclear medicine and PET exams. The MIRD method defines absorbed dose as the product of time-integrated activity in a source organ, which represents the biokinetics of a radiopharmaceutical, and organ dose conversion factors called S values.
Click me to learn more!
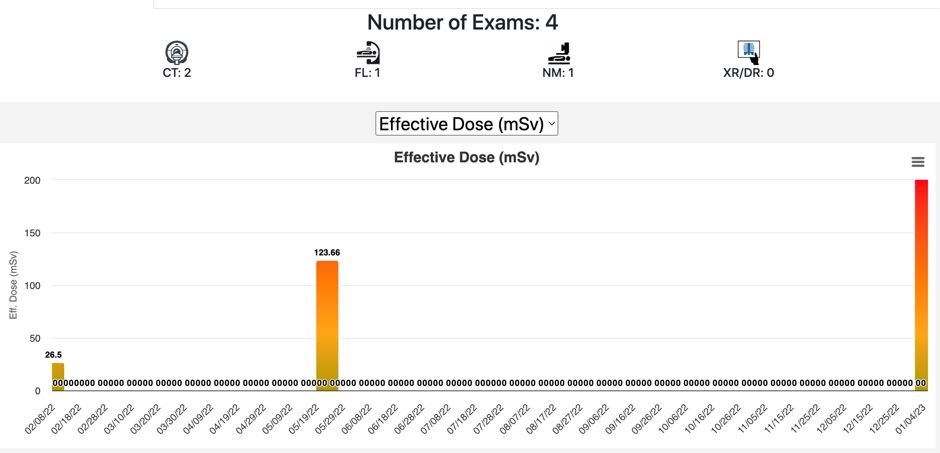
Track Cumulative Doses for all Procedures in Patient History
Easily track patients cumulative doses for all imaging procedures over time. See the combined dose for X-ray, Fluoroscopy, Nuclear Medicine, and CT. Get alerts when a patients cumulative does exceeds a user defined threshold over a time frame. Get the full picture of the radiation risk to your patients!
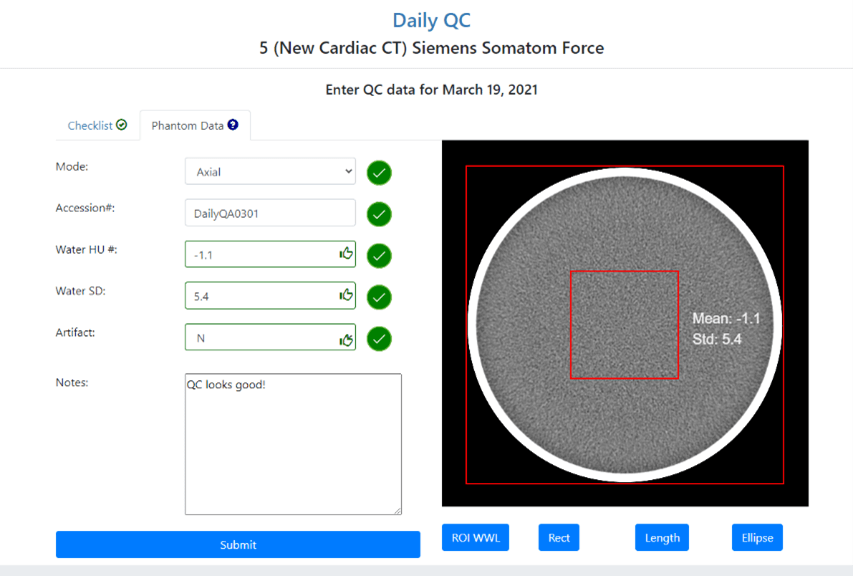
Auto Routine QC!
Another way we ensure optimal scanner performance is with our no-click automated QC tool. This tool provides rigorous QC measurements that lead to greater confidence and performance stability of your scanners. In addition to reducing the time staff spend collecting and reviewing QC, this tool standardizes QC procedures and minimizes scanner downtime by catching performance issues before they can impact patient scans.
Click me to learn more!
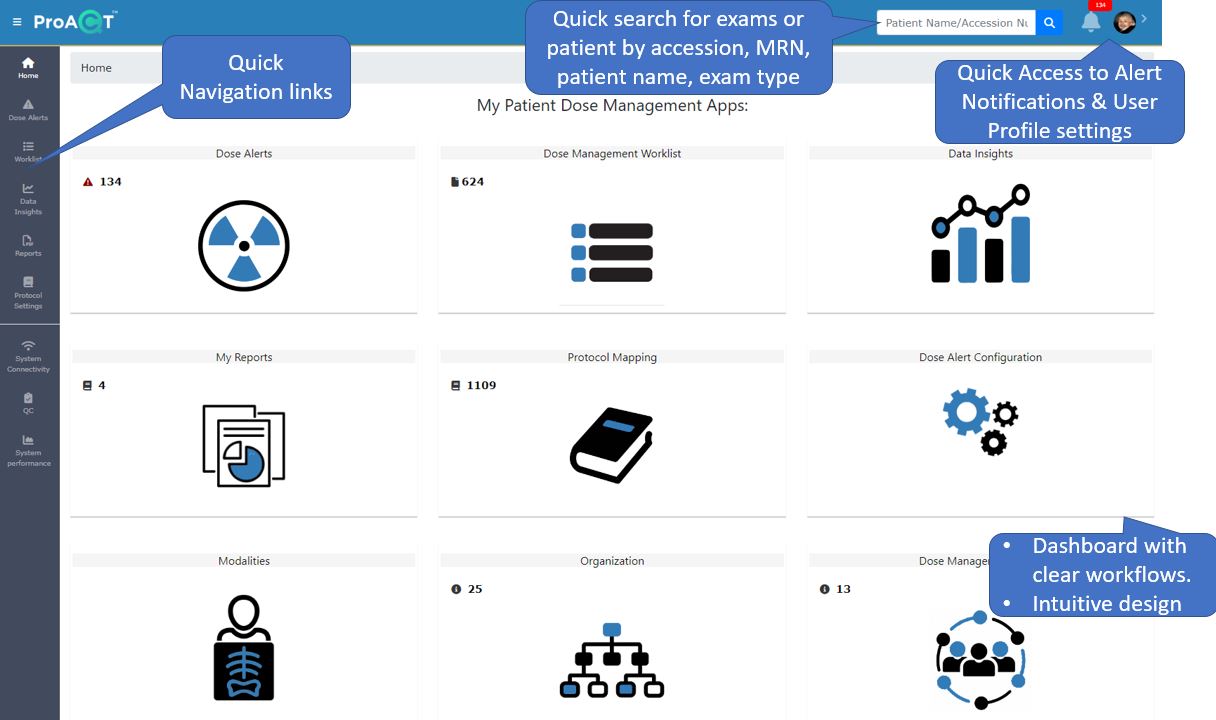
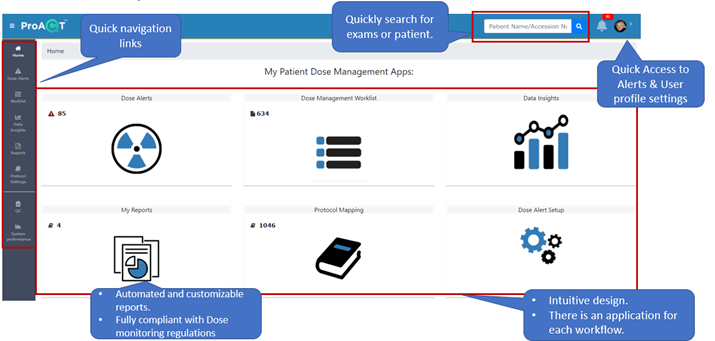
Intuitive Dashboards
- Dose apps provide clear workflows for dose management efforts.
- Quick links to alerts, reports, analytics, worklist, protocol books.
- Customize user settings, including alerts & reporting.
- Quick search for exam or patient.
- Easily setup and configure alert thresholds in the Dose Alert Setup App.
- Access full inventory of modalities organized by site or department.
- Manage userbase with assigned roles.
Protocol Mapping
- ProAqCT allows users to remap protocols by selecting a suggested protocol mapping from the RPID dropdown (left) or by searching the full lexicon (right).
- The auto complete search capability of the lexicon facilitates searching by key words.